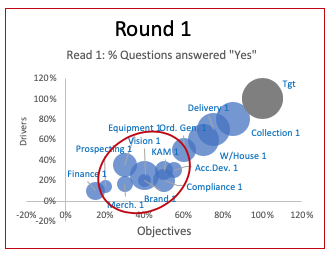
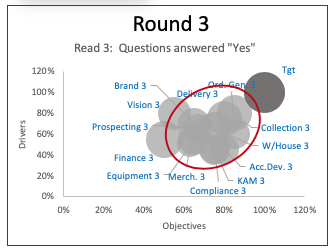
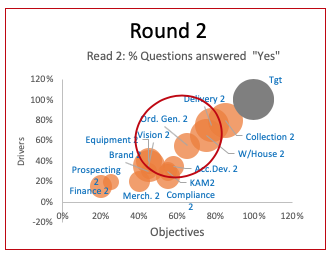
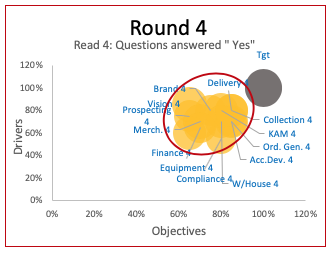
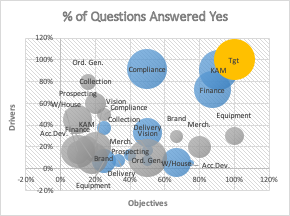
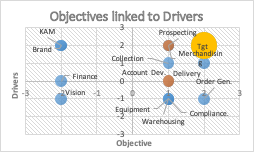
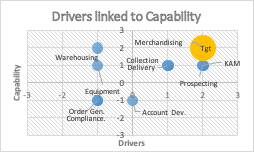
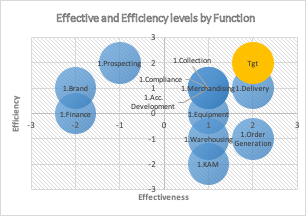
Tracking my progress Improvement can be tracked using our bubble graphs which forms par of our output after the questionnaire Our 4 step process drives improvement That can be tracked visually by increasing the size of the capability bubble and moving it to the top right corner of the graph How, and why? By evaluating 3 areas that highlight where you are winning or losing, the extent to which you are winning or losing, and the associated cost Are you winning or losing? The extent to which you Wining or Losing -2,-1, 0, +1,+2 At what cost are you Wining or Losing Level of Effectiveness vs Efficiency DIY: Diagnose yourself It really is that easy… Learn more Get in touch today You are welcome to try our dipstick test for free or contact us to get a quote for the full evaluation so we can get your business on the right track. Contact us